The MCG takes a systems approach to diagnosing heart related health issues using mathematical models. The MCG is based on the theories by Eüler (who mathematically modeled the blood flow of the human body) and Lagrange (who mathematically modeled the heart muscle). The MCG does this by combining the results using six mathematical transformations derived from the fusion of both coordinates via a Laplace Transform. The six functions depict the internal communication channels of the heart as a whole. By adopting data mining and machine learning techniques, the MCG technology culls patterns from a large empirical patient database to identify those with abnormal heart conditions.
The MCG has received FDA 510K approval and an AMA CPT billing code. Under current definitions, the MCG is described as:
“The Analysis System is intended to be used as “an aid” to diagnosis by means of analysis of the EKG waveform in the frequency domain (power spectral estimate).”
“Current descriptor of 0206T: AMA CPT 2013 Descriptor for MCG Technology 0206T Released January 1, 2012 Implemented July 1, 2012. Computerized database analysis of multiple cycles of digitized cardiac electrical data from two or more ECG leads, including transmission to a remote center, application of multiple nonlinear mathematical transformations, with coronary artery obstruction severity assessment.”
Performance Of An MCG Test: A Four Step Process
MCG is performed in the following four steps.
- Multiple cycles of complete resting ECG analog signals from leads II and V5 are recorded by a portable device from a patient at the point of care. The recorded signals are then digitized, encrypted and securely transmitted along with the patient’s demographic information to a central data center for processing.
- The computers at the central data center perform a Fast-Fourier-Transformation of the signals from each lead, preparing them for a series of additional mathematical transformations. Research over the last three decades has demonstrated that these mathematical functions are able to extract physiological information embedded in between the two left ventricular leads, II and V5.
- MCG mathematically transforms the complex non-linear information obtained in Step 2. The mathematical transformations employed include multiple non-linear mathematical functions such as auto and cross power spectra, cross-correlation, coherence, impulse-response and phase shift. These functions produce 166 indices. The index patterns from an individual patient are compared to similar patterns obtained from people with or without heart disease whose MCG data has been entered into a large empirical database. This database consists of more than 200,000 individuals, of whom 27,000 had various degrees of CAD, and whose CAD status and severity are included in the database and have been confirmed by coronary angiography. Importantly, the database also contains MCG results from normal people as well as many patients who have one or more non-ischemic cardiac diseases. Therefore, the database is used to distinguish MCG patterns in patients with cardiac ischemia from MCG patterns in patients with non-ischemic cardiac disease and those with both cardiac ischemia and non-ischemic cardiac disease(s). Approximately 13,000 of the patients in the database have had normal coronary angiograms or have been determined to have no evidence of CAD after independent evaluations by two cardiologists. The database has been carefully accumulated over many years, and the MCG patterns of each entrant have been validated and correlated with the presence (or absence) and severity of CAD, from as little as 30% single vessel disease to 100% occluded coronaries with or without collateral formations. The database has been designed to be robust and to minimize bias by including, among other things, 49% of its data from women and an age range of 14-100 in the CAD and non-CAD groups, as well as people with many forms of heart disease (e.g., arrhythmias, hypertrophy, cardiomyopathy), in addition to CAD. The database also contains other clinical and diagnostic data from all 200,000 patients, including information about other non-cardiac disease entities.
- Based on the comparison to the reference database, an overall ischemia severity score (ranging from 0 to 22) is reported, which can be understood through seven Ischemic Grade levels:
7
Gravely High Myocardial Ischemic Burden Minimum MCG Severity Scores ≥ 15 with the presence of local or global myocardial ischemia 6
Extremely High Myocardial Ischemic Burden Minimum MCG Severity Scores ≥ 7.5 but ≤ 15 with the presence of local or global myocardial ischemia 5
High Myocardial Ischemic Burden Minimum MCG Severity Scores ≥3.5 with the presence of local or global myocardial ischemia 4
Intermediate Myocardial Ischemic Burden All MCG Severity Scores fluctuating above or below 3.5 i.e. any score lower or higher than 3.5 appearing in the same session; and there are simultaneous fluctuating myocardial ischemia patterns represented by either local, global myocardial ischemia or occasional myocardial ischemia altogether absent in the same session 3
Collateral Circulation Group Various degrees of reduced Myocardial Ischemic Burden, but signs of functional changes due to chronic exposures remain
Any MCG Severity Scores ≥ or ≤ 2.0 with significant Pathological and Physiopathological conditions related to long-term exposures to myocardial ischemia as results of obstructive coronary artery disease, i.e. myocardial remodeling, asynchronization, decreased myocardial compliance, etc., per MCG reporting standards. 2
Low Myocardial Ischemic Burden Maximum MCG Severity Scores ≤ 3.5 but ≥ 2.0; there are fluctuating myocardial ischemia patterns represented by either occasional local, global myocardial ischemia, or with myocardial ischemia altogether absent in test(s) in the same session 1
Normal Any MCG Severity Scores < 2.0 without local or global ischemia and minimum Pathological and Physiopathological conditions reported
Clinical Application
MCG data has been used to predict the findings of coronary angiography in several carefully designed and well-conducted prospective double-blind validation clinical trials (Weiss 2002, Grube 2007, Grube 2008, and Hosokawa 2008, which are included as references 3, 4, 5 and 6, respectively). These trials were conducted in seven countries and three continents (North America, Asia and Europe). In these studies, MCG was performed on patients who were scheduled for elective coronary angiography by cardiologists who, on the basis of clinical impression and standard non-invasive testing, believed that the patients had an intermediate to high risk of having relevant coronary artery stenosis (CAS). Relevant CAS was defined as a 70% or greater stenosis of one or more major epicardial arteries or a 50% or greater occlusion of the left main coronary artery. The patients in these trials represent “real-world” care, much like the patients studied by Patel. In this regard, it is not surprising that the percentage of patients (~40%) who were found to have relevant CAS in each of these trials was similar to the percentage who had relevant CAS in the Patel study. This means that even though the treating cardiologists believed that some patients in these four trials were at high risk for significant CAD, the patients studied in these trials were, in reality, at intermediate risk of having significant heart disease rather than at high risk. Therefore, these trial results are directly applicable to most patients seen with suspected CAD.
Former NIH fellow Dr. Alan Berson (Appendix 4) ensured that the double-blinded trial’s design integrity and data quality. All the data analysis has been performed by an extraordinary independent biostatistician, Dr. Michael Imhoff, MD, PhD of Germany.
The studies were all similarly designed as follows:
- All patients (n=1076) underwent MCG prior to coronary angiography for any indication. Angiographers and staff at each study site were blinded to all MCG results and findings.
- Coronary angiography was recorded digitally and underwent central review by two independent cardiologists who were blinded to the MCG results.
- An MCG score of 4.0 or higher was considered indicative of a hemodynamically relevant coronary artery stenosis of >70% in at least one large-sized vessel.
- All of the trials, whether single or multi-center from three continents in seven countries, produced statistically reproducible results.
Each of the trials had similar findings. Strobeck (2009, reference 7) combined the results of these studies into a meta-analysis that reported the following:
- MCG correctly classified 941 of the 1076 patients with or without relevant stenosis.
- Sensitivity/specificity: 91.2%/84.6% (in agreement with above mentioned peer review published trials).
- Positive/negative predictive value: 81.9%/92.6% (in agreement with above mentioned peer review published trials).
- The results were similar across all studies and were not affected by sex, ethnicity, geographic location or Framingham risk score.
This diagnostic performance compares favorably to other non-invasive diagnostic tests. For example, a review of stress scintigraphy studies reported a wide range of sensitivities from 44%-89% and specificities of 89%-94% for 2+ vessel disease (Elhendy 2002, see reference 11). Numerous studies of exercise echocardiography as a diagnostic tool for CAD have been conducted, and reported sensitivities range from 31% to over 90%, while specificities range from 46% to nearly 100% (Geleijnse 2007, Marwick 2009, and Smart 2000. See references 12, 13, and 14, respectively). These studies also show that these modalities are not applicable for patients with single vessel CAD.
The inability of standard noninvasive diagnostic tests to accurately diagnose CAD in women has been a longstanding problem in cardiology. Importantly, in each of these trials, the sensitivity, specificity and positive and negative predictive values of MCG in predicting the existence of relevant CAS in women was equivalent to that in men. This may be because the database against which individual patient data is compared takes into account the physiological differences between males and females as well as physiological changes due to aging. This is accomplished by populating the database with approximately half of the data coming from women (normal women and women with heart disease), and by grouping the data by age group and sex (e.g., men aged 51-60, 61-70 and women aged 51-60, 61-70, etc). In other words, the MCG database design is both age and sex “normalized.” In summary, these trials provide evidence that MCG is a clinically useful tool for assisting physicians in the diagnosis of CAD in women. Strobeck et al. (2011, reference 8) have also completed a Paired Comparison of MCG with stress single photon emission computed tomography (SPECT) myocardial perfusion imaging (MPI) in 165 consecutive patients who were at intermediate risk of having CAD based on clinical findings and who agreed to undergo both MCG and stress SPECT, followed by elective angiography if SPECT was abnormal or valvular heart disease was present. They represent the diagnostic experience of a typical “real world” cardiology practice. The definition of relevant CAS was the same as that used in the other studies. Similar to the above meta-analysis, an MCG disease severity score of <4 (cutoff point) was used to indicate the absence of relevant CAD. A total of 116 patients with abnormal SPECT MPI tests, persistent chest pain or significant VHD were entered into the final analysis. The following results were reported:
| Parameter (%) | MCG | SPECT | P-Values |
| True Positive | 48% | 45% | <0.02 |
| True Negative | 55% | 9% | <0.01 |
| False Positive | 8% | 54% | <0.02 |
| False Negative | 5% | 8% | <0.01 |
| Confidence Intervals | |||
| Sensitivity | 91% | 85% | 0.79 – 0.97 |
| Specificity | 87% | 14% | 0.76 – 0.94 |
| Negative Predictive Value | 86% | 45% | 0.81 – 0.97 |
| Accuracy (%) | 92% | 53% | P<.001 |
This is the first study that directly compares MCG to a standard noninvasive test for CAD. The sensitivity, specificity, negative predictive value and overall accuracy of MCG in detecting the presence of relevant CAD in patients prior to coronary angiography is similar to that found in other studies, again demonstrating that MCG is a valuable aid to physicians in the diagnosis of relevant CAD (>70%). Furthermore, in this study, MCG was significantly better than SPECT MPI with respect to overall sensitivity, specificity and negative predictive value in predicting the existence of relevant CAS. Additional analysis of the data revealed that if the MCG data was used as the primary determinant for referral to coronary angiography, only 5/116 patients with a negative MCG score and obstructive coronary disease on angiography would not have been referred for angiography, while 55/116 patients with negative MCG scores and non-obstructive coronary disease on angiography would have been spared coronary angiography.
The MCG Report
Using objective scientific measures, the MCG provides clear proof of “medical necessity” for further treatment when cardiac issues are found.
All reports are kept safely in a FIPS-compliant encrypted system that is also HIPAA-compliant. MCG tests done by each facility are available only to that facility.
Each MCG report is broken into four sections: Ischemia, Suggestions, ECG Tracing and About MCG.
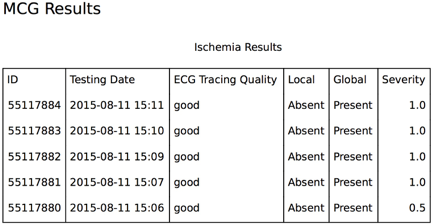
1. Ischemia
The first section of the MCG report details the ischemia burden on the patient’s heart.
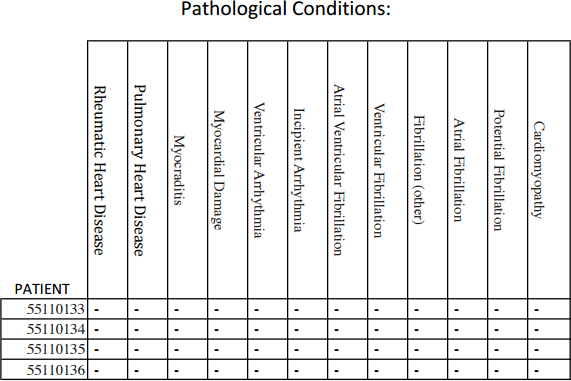
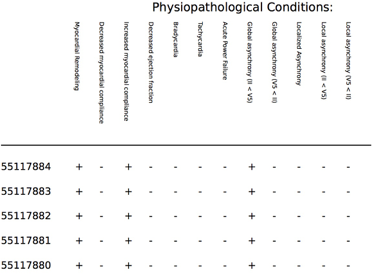
2. Suggestions
In the second section, other tertiary conditions are reviewed. These include:
|
|
3. ECG Tracing
The third section includes MCG Tracings.
The MCG interprets these tracings using its mathematical model of the heart and the blood supply. These tracing are used to create the measurements that are fed into the MCG system.

4. About MCG
The fourth section labeled “About MCG” provides information about the system itself.
This section has general descriptions of the system, how it works, what information it can provide to the physician and the legal language surrounding the terms of the diagnostic reporting that the system provides to the doctor.